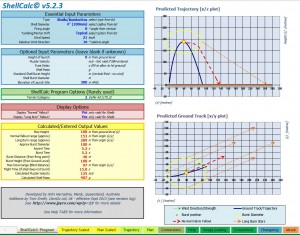
A new version of Shellcalc© is available (5.23)
The following changes have been made
- Taken out the backgrounds on the scaled plots to make copy/paste easier into Powerpoint (It comes in transparent now if you just select the Excel graph)
- Updated the copy/paste instructions
- Added a scaled plan plot
- Added a screengrab of superimposing Shellcalc© onto Google earth images
- Changed the algorithm for calculating long duration debris – this has increased the distances a bit, but is probably more accurate
- Changed the display of long burn fallout so it comes directly off the shell burst diameter at 4 points
- Updated the terrain category function
- Changed some of the term on the main screen to make it clearer
We have just run a course on getting the most from Shellcalc© – more details of upcoming courses at http://www.pyroworkshops.com
A few questions resulted from the Workshop:-
- The plots on the main screen of shell bursts may be elliptical because Excel automatically scales the x/y axes on the plots on that screen.
- Shellcalc© IS NOT a simulation tool – it is a tool for predicting shell trajectories and debris distances
- There are now 2 new graph screens where you can change the axes to maximise the information on the plot (as a normal Excel operation – right click and try) – specifically there to facilitate copy/paste and superposition on to images such as from Google Earth
- The “long burn” fallout and “normal debris” fallout plots are not meant to show exactly how the debris falls, but the distance to ground level is accurate
© Journal of Pyrotechnics and CarnDu Ltd


could you add 400mm shells as the UK have started importing them again and would be nice for shell calc to allow for them.
perhaps you can suggest that direct to the shellcalc pages? i’ll look and see but the problem with very large rare shells is that their performance characteristics differ widely